
Master QR Code Analytics with Google Analytics Integration
Track every scan, measure campaign performance, and optimize your QR code strategy with data
“Data without insights is just noise. With proper tracking, every QR code scan tells a story—who scanned it, when, where, and what they did next. This intelligence transforms QR codes from simple links into powerful analytics tools that drive strategic decisions and measurable ROI.”
Founder, mobiQode
QR Code Types with Built-in Tracking
Whether it’s on posters, flyers, product packaging, or business cards, QR codes let people jump straight to your digital stuff.
But just making a QR code isn’t enough. If you don’t know how many people are scanning it, where they’re coming from, or if they’re actually taking action, you’re flying blind. That’s where Google Analytics (GA) comes in.
In this guide, we’ll show you how to track your QR codes with GA so you can see what’s working, tweak your campaigns, and actually make your marketing spend worth it.
Why track QR codes at all?
QR codes can bridge the gap between print campaigns and digital interactions. If you’re not tracking, there’s no way to tell if your offline marketing is actually doing anything.
QR code analytics fixes that. With tracking, you can see exactly how people are interacting with your codes and turn that into real results.
- Channel performance: Find out which stuff works best—flyers, posters, or event handouts.
- Conversion insights: See which promos, discounts, or campaigns are actually bringing in leads or sales.
- Geographic trends: Check where scans are happening so you know which areas are really engaging with your stuff.
How does tracking QR codes on Google Analytics work?
A QR code on its own doesn’t track anything; it’s just a shortcut to a link, video, photo, or text. You only see the numbers once someone actually scans it.
To track stuff, throw some UTM tags on the link. Google Analytics then knows where the traffic is coming from. Every scan gets logged so you can see what’s happening right in your dashboard.
For example, imagine a store running a seasonal promo in two cities. They tossed the same QR code poster in both cities but with different UTM tags. GA showed City A pulled in 3x more traffic than City B, so now they know where to drop more ads.
In short, tracking transforms a QR code from just a static link into a measurable marketing insight.
Note: UTM (Urchin Tracking Module) parameters are short tags you add to the end of a URL so Google Analytics can identify where your traffic is coming from. They don’t change the page itself but give context to the visit. Think of it as a label for your link. When someone scans a QR code with a UTM-tagged URL,
Google Analytics can see exactly:
- Which campaign drove the scan
- What channel it came from (flyer, poster, business card)
- How users behaved once they landed on your site
Using dynamic QR codes for tracking
There are two types of QR codes you can create:
- Static QR codes: Once generated, the link can’t be changed.If you skip adding UTMs or decide to send people somewhere else later, you’ll have to print a new code
- Dynamic QR codes: With dynamic QR codes, the link isn’t fixed, you can tweak it whenever you want. This means you can add UTMs, change the landing page, or even test different pages, all without reprinting
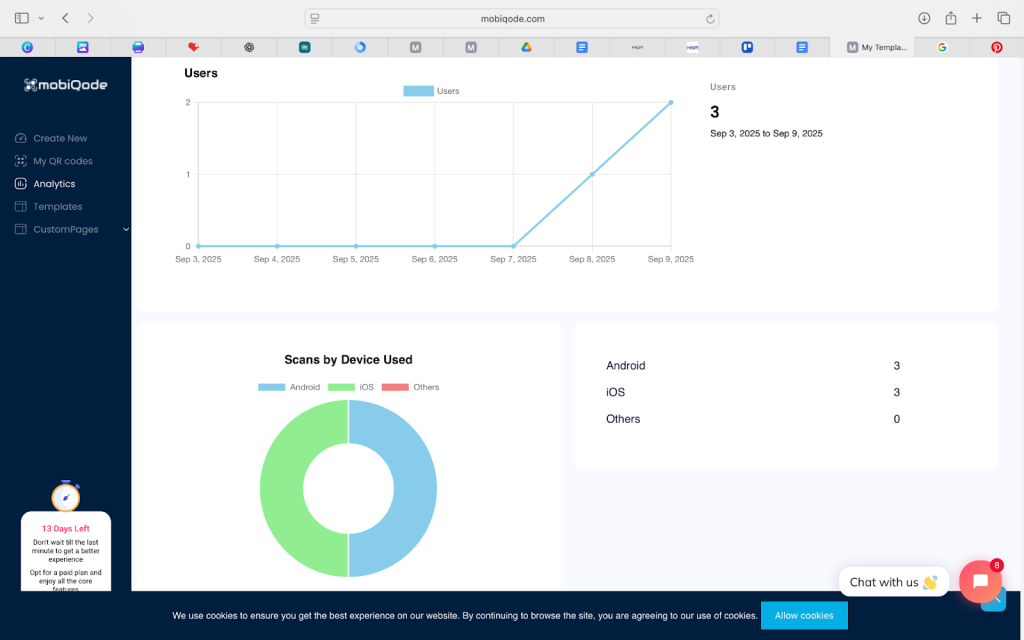
Dynamic QR codes also give you additional first-layer insights through the generator itself, such as:
- Total scans
- Unique vs repeat scans
- Date and time of scans
- Device type (iOS/Android)
- Location data
When combined with Google Analytics QR code tracking, you get both macro (website performance, conversions) and micro (scan activity, device breakdown) insights. This flexibility makes dynamic codes far more useful for marketing campaigns than static QR codes.
Step-by-step: How to track QR codes with Google Analytics
Here’s how you can set up QR code tracking with Google Analytics in just a few steps:
Step 1: Decide on your campaign
Decide what you want to track: flyers, posters, events, or business cards. Basically, figure out where your QR is going to exist.
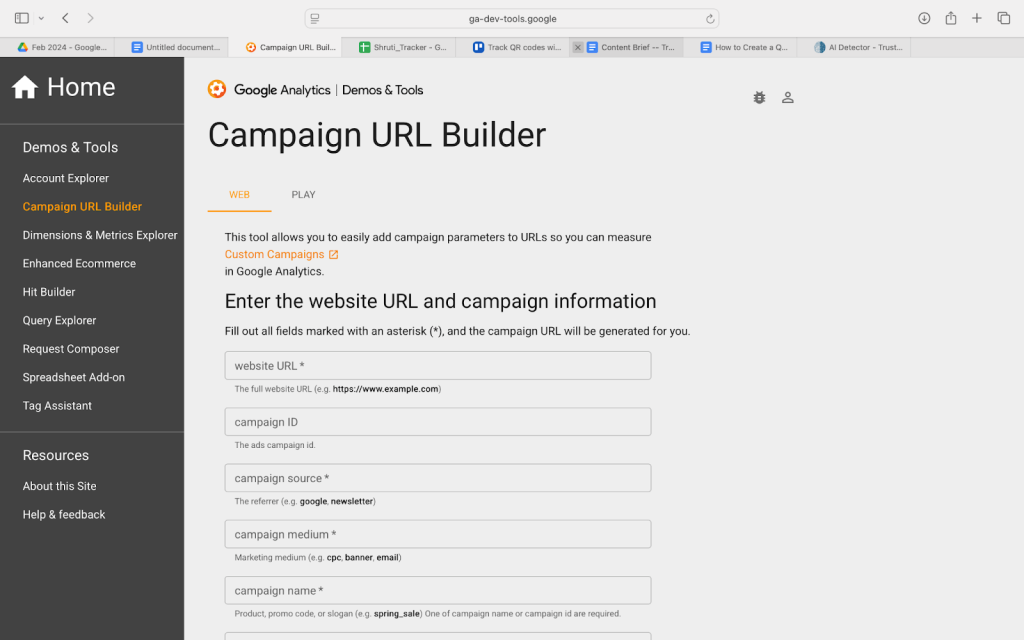
Step 2: Build your UTM-tagged link
Use Google’s Campaign URL Builder. Set things like:
- Source: QR
- Medium: flyer, poster, card
- Campaign: product_launch2025
This makes sure GA knows exactly where your traffic is coming from.
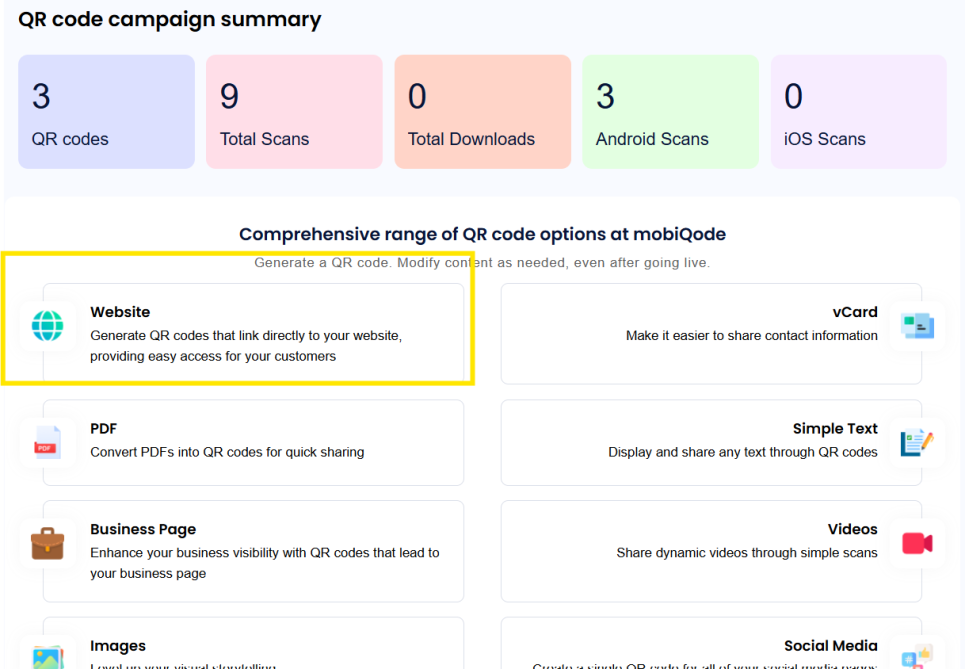
Step 3: Generate a dynamic QR code
Drop that UTM link into Mobiqode’s QR code generator and make a URL QR code. It takes seconds and keeps things super clean.
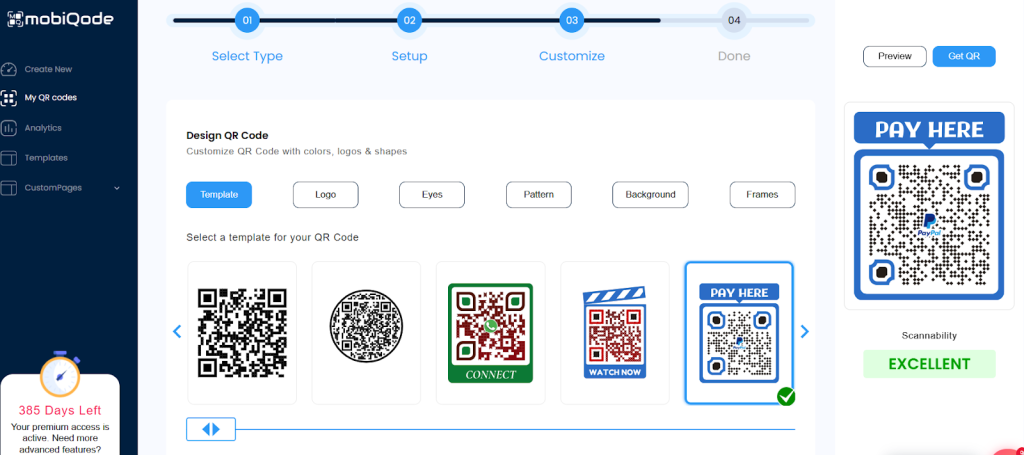
Step 4: Customize your QR code
Next, you can change the design, color, or frame to go with your brand identity. Just make sure the size is big enough to scan easily. A little branding polish makes your users more likely to trust and scan it.
Step 5: Place your QR code on marketing material
Stick it on flyers, posters, packaging, or even your business cards. The more spots you place it, the more scans you’ll pull in.
Step 6: Track results in Google Analytics
Open GA, go to ‘Acquisition’. Then, click on‘Campaigns,’ and filter by your UTM. You’ll see traffic, scans, and conversions. At this point you’ll know if your QR campaign is actually working.
Step 7: Adjust campaigns as needed
If it’s a dynamic QR code, you can add UTMs, swap links, and run tests anytime. There’s no need for reprinting and it’s handy when campaigns change or you just want to try out new ideas.
Conclusion
Tracking QR codes with Google Analytics turns offline campaigns into measurable digital assets. By combining dynamic QR codes with UTM parameters, businesses can get complete visibility into user behavior, scan performance, and ROI.
Start tracking your QR campaigns today with a reliable QR code generator—and transform your print marketing into a data-driven strategy.
QR codes are the bridge between the physical and digital world. We’re making it simple for everyone to create, share, and connect.
— Ankita Saraswat, Founder of mobiQode
Ready to Create Your QR Code?
Choose from our suite of specialized QR code generators